
What is a system of two linear equations?
A system contains two
variables; x,y and two equations
Ex. Ax+By=C
Dx+Ey=F
How do you solve a system of two linear equations?
1. Find a solution to fit the pair of variables and make the equation
true.
Solution: an ordered pair of x,y
Ex. 3x-2y=2
x+2y=6
If you are given an order pair, plug both in to check which one
fits.
a.) (2,2)
b.) (0,-1)
3(2)-2(2)=2
6-4=2
2+2(2)=6
2+4=6
→ Both check so A pair is a solution, now try B pair.
3(0)-2(-1)=2
0+2=2
0+2(-1)=6
0-2=-2
→ B is not a solution because the second equation does not check.
What if NO
solution pair is given?
Solving equations using graphs
If no solution pair is given, then you can try solving
graphically.
You are given the following system with no order pair, you must
graph it in order to find its solution pair.
3x-y=7
2x+3y=1
There are many methods to graph the
system; y=mx+b or you can create an x,y table to plot the
points.
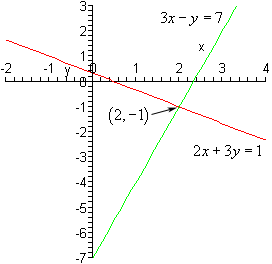
Once you graph the equation, you find that the solution pair is
(2,-1)
It is encouraged to plug in the pair to make sure the system
checks.
3(2)-(-1)=7
6+1=7
2(2)+3(-1)=1
4-3=1
→The solution pair checks when inserted into the linear system
equation thus, you know that (2,-1) is the correct answer.
Linear Systems with One, Infinite, or No Solutions
When graphed, a system can have more than one solution, infinite or no
solutions at all.
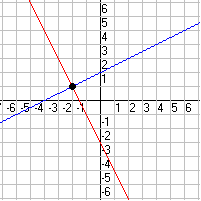
One Solution : When two lines intercept, the
interception point is the solution.
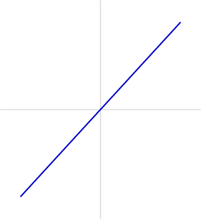
Infinite Solutions: The graph contains only one single
line.
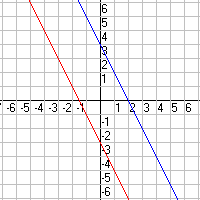
No Solution: The graph contains parallel lines and no
interception point.
Think you're ready?
Now you
try solving some problems to see how well you do!
Checking solution of a
linear system
*Plug in solutions to find which pair is the solution of the system.
1.a) (3,2)
6x+2y=20
b) (-2,5)
3x+4y=17
2.a)
(-4,-2)
5x-y=16
b)
(3,-1)
x+y=2
Solving a system by the
graphing method
* Graph the linear system equation and find the solution.
3.3x+4y=-10
-7x-y=-10
4. y=5x
y=x+4
Systems with Many or No
Solutions
*Find how many solutions the following graphs have.
5. 6.