2.7.3.Absolute
Value Functions
By: Alvin Yang
Period 1
All absolute value equations follow the same format:
y=a|x-h|+k
In the equation listed above, the letters a, h, and k, when changed, change the shape and location of the graph. When a absolute value equation is graphed, it makes a "V" shape.
A, in an absolute value graph, changes the "slope" of the graph, the smaller a is, the more shallow the "V" shape. The larger a is the more narrow the "V" shape is. If a is negative, the "V" is upside down. For example:
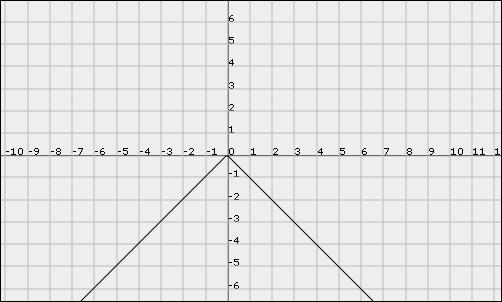
In this graph, a is -1 since the “V” is downwards and the graph goes down
one and over one.
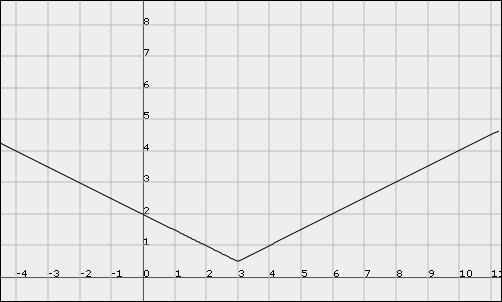
H and k, in an absolute value equation, change the location of the lines. They form the vertex of the graph. H is the x-coordinate and k is the y-coordinate. Therefore, the vertex of an absolute value equation graph is (h,k). Example:
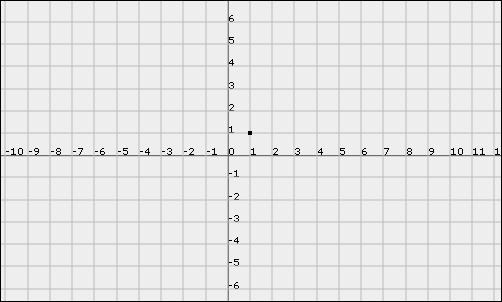
In this graph, h would be 1,
and k would be 1.
Graphing Absolute
value equations
For this example, the following equation will be used:
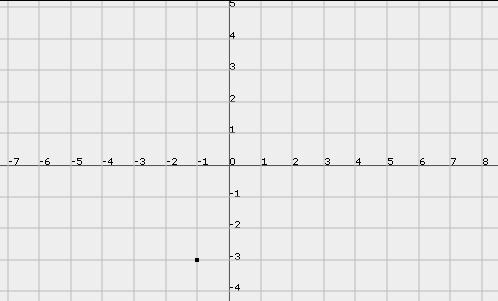
y=2|x+1|-3
First, you must find the vertex, in this case (-1,-3).
Next, you plot the vertex.
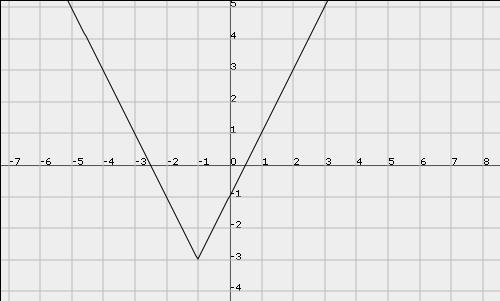
After that, you plot the other lines based on the "slope", a.
Practice Problems
1. Find the Vertex:
y=5|x+7|-5
2. Find the Equation of the following graph:
Graph the following:
3. y=2|x-2|+1
4. y=2\3|x+1|-4
5. y=-1/4|x+1\2|-6